Structural Inequity
Funding
Bottom Line Up Front
The St. Louis Region’s Education Funding Landscape is Highly Uneven and It’s Not an Accident
Download This Section
Download the Funding section of the report
Download Entire Report
Download the entire report
Background (in Brief): Funding for education in our region comes mostly from local sources (56%), followed by state sources (30%), followed by federal sources (7%). Local funding is inequitable; state funding is volatile; federal funding is restrictive. High-need districts disproportionately feel all of these shortcomings. The Foundation Formula is Missouri’s way of determining how much state funding a district receives, and several aspects of it are inequitable by design.
Findings Snapshot:
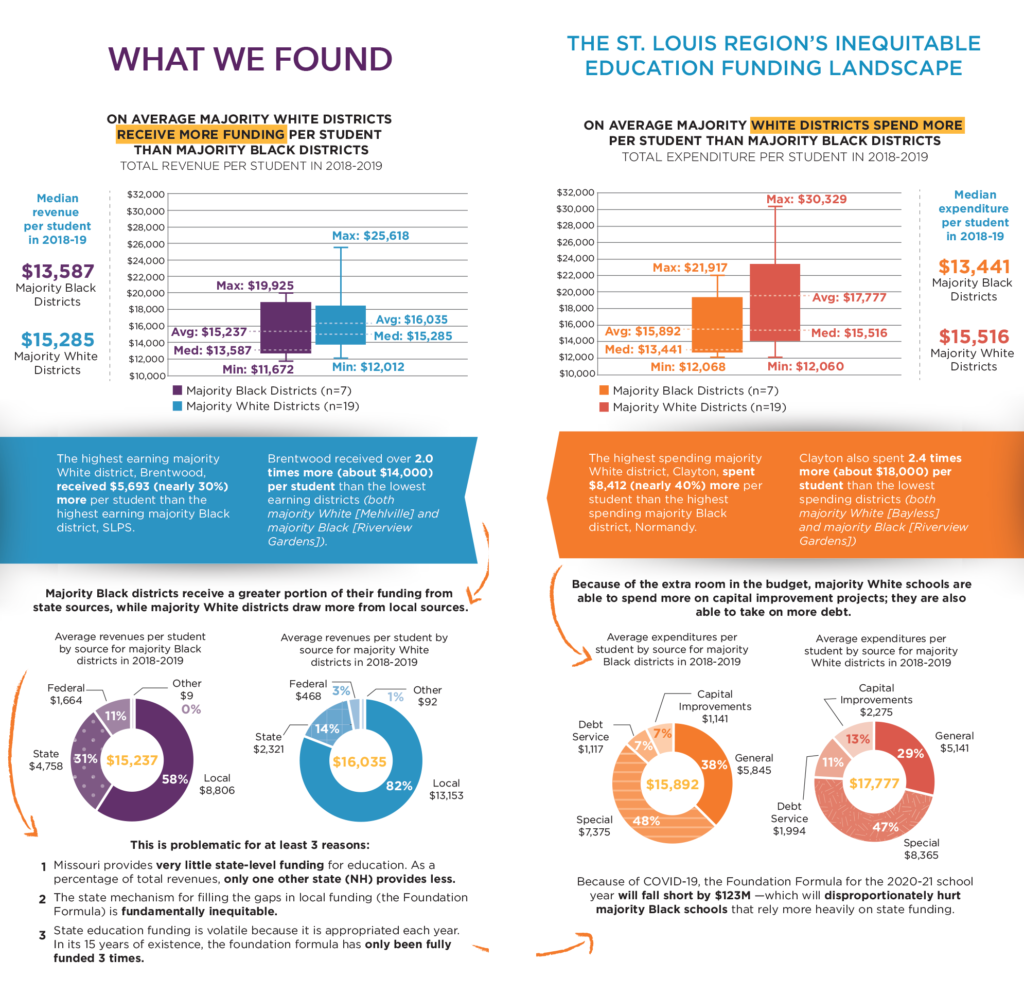
- On average, majority White districts in St. Louis receive and spend more funding per student than Majority Black districts (median difference = $1,698 more received and $2,076 more spent in 2018-2019). The highest spending majority White district spent $8,412 (nearly 40%) more per student than the highest spending majority Black district and 2.4 times (about $18,000) more per student than the lowest spending districts.
- Majority Black districts receive, on average, a greater portion of their funding from state sources (31% vs. 14%), while majority White districts draw more from local sources (82% vs. 58%). This is problematic for at least 3 reasons:
- Missouri provides very little state-level funding for education. As a percentage of total revenues only one other state (NH) provides less.
- The state mechanism for filling the gaps in local funding (the Foundation Formula) is fundamentally inequitable.
- State education funding is volatile because it is appropriated each year by politicians. In its 15 years of existence, the Foundation Formula has only been fully funded 3 times.
Selected Next Steps
(*** indicates a near-term area of focus for FTF):
***Grow broad community understanding of the structural inequities in the St. Louis regional education landscape including the Foundation Formula and its structural weaknesses and potential paths for improvement toward equitable funding. [funding]
Grow next-level education partnerships to organize and strategize on equity-centered advocacy to redesign education funding and accountability mechanisms, including the Missouri Foundation Formula.
In partnership with diverse stakeholders, identify statewide advocacy targets. Potential options include modifying the Foundation Formula to ensure equity is centered by, for example, removing Hold Harmless provisions that ensure that already privileged school districts receive funding in excess of what the Formula otherwise says they need.

“The way we fund schools is deeply problematic and I feel like I could just mic drop with that. It’s unfair that some are having to build relationships with anybody they can find and there are others whose families and wonderful little foundations are basically funding the school. It is a real problem and kids 100% see that difference. They can have pride and know, “Hey, we’re scrappy. We’re figuring this out.” At the same time, they see how other children have things just handed to them and provided for them. There have been efforts across the St. Louis region and there are so many wonderful, amazing, committed, social justice warriors trying to figure out how to reduce the inequities among school districts. At the same time, I hear and understand how every parent thinks to themselves, “I want my child to have everything.” That totally makes sense. So when there’s this belief of a zero-sum game, where if another child is offered more, then that means my child gets less — when people think that way, it’s so difficult to engage in a deep conversation around equity. And there are people willing to go there who say, “I got my child and I’m going to give this to another child.” But that is not every parent. And to ask parents to do that is so crazy. So the fact that individual parents and school districts have to do this rather than there being structures set up to support every child in an equitable fashion, that just breaks my heart.”
Click here to read the full conversation between Dr. Courtney M. Graves and Dr. Amanda L. Purnell.
Background
In the 2018-19 school year, Missouri public schools spent just over $12.8 billion to educate 881,352 students. About half (58%) of these funds came from local and county government coffers. Another 31% came from the state and 8% came from the federal government. This level of state funding puts Missouri in 49th place for state revenue as a percentage of total revenue. These three sources, local, state, and federal, provide the bulk of funding for education in our region. Here are the essentials to know about each.
Local funding: The highly inequitable and regressive largest piece of the pie
Local funding makes up the greatest wedge of the education funding pie in Missouri (and 21 other states including the District of Columbia). Most of those local dollars come from property taxes on residences, farms, and businesses. Other sources of local funding include 50% of dollars generated by a statewide sales tax known as Proposition C, a state-assessed railroad and utility tax, and other local taxes, including those at the municipal or county level. We have more to say about the use of local property taxes to directly fund education… and we say it in Section 6! Right now we’ll just say that there is vast variation in property wealth by district, so this funding source alone is highly inequitable and regressive, with districts with low levels of property wealth (and usually higher proportions of low income students with greater needs) receiving less funding.
State funding: The great equalizer…at least in theory
How much funding a district receives from the state is determined through the Missouri Foundation Formula. Despite being the result of legal action (Committee for Educational Equality v. State of Missouri, 1993) that found the previous system of education finance to be unconstitutionally inequitable, the current formula has received low marks for still being inequitable and inadequately transparent However, in 2009, the state Supreme Court found the Formula to be in keeping with the state’s constitutional commitment to education, which makes no stipulations about quality, equity, or adequacy, and simply requires 25% of state revenue to go to education.
Stick with us here
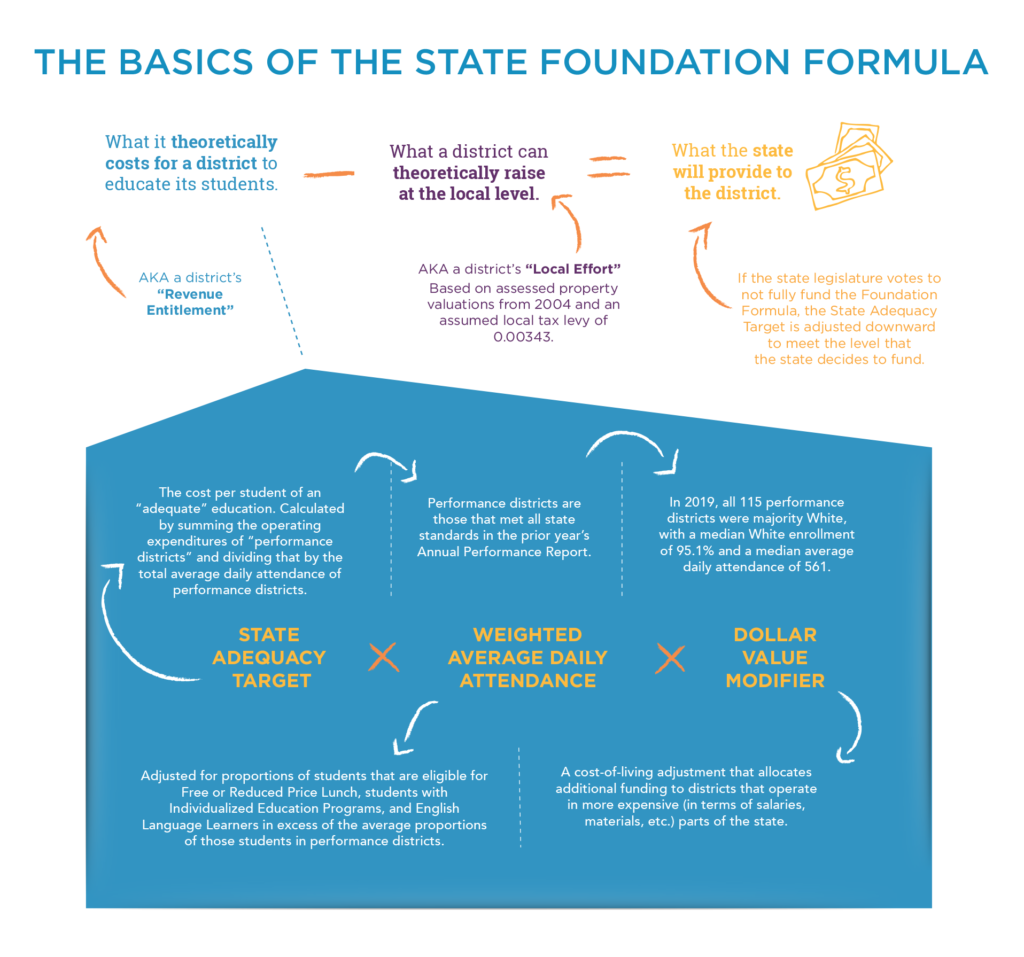
We’re going to walk through the logic of the current Foundation Formula because you’ve got to know the rules to break them, or rather, make them more equitable. [Check out the infographic for a visual map of our explanation.]
In theory, though, the Formula is supposed to ensure adequacy by providing all students with the resources needed to succeed. The Formula is largely based on the number and type of students in a given district and on the local funds it can draw on. It calculates a “revenue entitlement” representing the total amount of local and state dollars a district is “entitled” to receive, and then it subtracts out the local component to leave the state funding responsibility. That entitlement is calculated based on three factors:
- A given district’s attendance or “weighted average daily attendance,” including enrollment of students that tend to be more costly to educate (e.g., students with disabilities, students receiving free and reduced price lunch, and students with limited English proficiency);
- The state’s determination of the cost of educating one student, or the “state adequacy target.” For the 2020-2021 school year, this amounts to $6,375 per weighted average daily attendance. It is calculated based on the operating expenditures of “performance districts” divided by their attendance. Performance districts are defined in state statute as those that have met all the indicators on the Missouri Schools Improvement Program (MSIP) Annual Performance Report (APR).
- A cost-of-living modification or “dollar value modifier.” This modifier allots more funding to districts located in parts of the state where costs (e.g., salaries, maintenance, transportation, building supplies, etc.) are higher.
Once a district’s entitlement is calculated, the state then determines the “local effort,” or the share of that entitlement that should come from local funding sources. Local effort is determined using assessed property values from 2004 (for reasons and with regressive implications discussed below), local taxes collected for education during the 2004-2005 school year, and a flat estimated local tax rate of $3.43 per $100 of assessed property valuation. The state is on the hook for the balance left over when a district’s local effort is subtracted from its revenue entitlement. The Formula makes use of multiple “hold-harmless” provisions that ensure that a district’s funding can only go up from the 2005-06 levels when the Formula was last set.
The original price tag for the state’s portion of the Formula was $800 million in 2005. It was to be phased in over seven years, and for a few years it was on track. Then the recession hit. In 2009, legislators removed a 5% cap on formula spending growth, believing that revenues would grow fast enough to keep up (they didn’t). For these, among other reasons, the Foundation Formula was only fully funded for the first time in 2017—after adding the spending cap back—and again in 2018 and 2019. Due to COVID-19, $123 million will be withheld from funding the Foundation Formula in 2020.
As this yo-yoing history shows, state funding for education can be quite volatile because it is reappropriated every year. This volatility makes planning difficult, especially for higher-need districts that disproportionately rely on state funding.
Federal: Restrictive and waning funding
The United States Constitution outlines education as a responsibility borne primarily at the state and local levels. In keeping with this, the federal government has historically contributed funds to supplement—not replace—state and local funds. Federal funds tend to be programmatic or grant-based and also tend to focus on specific groups of students, including low-income students, students with disabilities, and English language learners.
Some examples of these programs include Title I (also known as No Child Left Behind and later, after some changes, the Every Student Succeeds Act) and the Individuals with Disabilities Education Act. Because of the targeted nature of these programs, federal funds tend to come with more restrictions.
Federal dollars have decreased in the past decade from a high of 0.49% of GDP in 2010 to 0.20% in 2020.
Inequitable by Design
You might hope, at least in theory, that local, state, and federal support for education would purposefully come together to even the playing field and ensure every student is provided the funding they need to get a quality education. It turns out there are structural reasons and tactics used by policymakers to subvert that intent.
Some of these reasons, like the direct reliance on property taxes and other local sources of funding, will be discussed in Section 6. A few others to note at this point are some major shortcomings in the Foundation Formula.
4 of the Major Flaws of the Missouri Foundation Formula
1. The hold-harmless provision.
In short: the state, bending to legal pressure, built a Foundation Formula that did more to ensure adequate and equitable funding for all students, but legislators built a back door out of it for the districts that were favored by the old system. “Hold harmless” measures keep a school district’s state funding from decreasing by allowing them to receive funds based on the old foundation formula if the current (2006) formula would give them less funding of the two.
In other words, this provision tends to keep funds going to districts that do not need them, which may be why, between 1995 and 2014, Missouri was one of few states whose state and local funding became more regressive.
In the 2019 school year, 186 (about one third) of the 527 school districts in the state were held harmless. While these measures were intended to ease the transition to the current formula and ensure an ever-growing funding base for education, they also preferentially shunt funds to small and/or wealthy school districts instead of redirecting them to districts with higher need.
The hold-harmless provision is, in fact, hardly harmless for many low-income districts.
Here are some ways that hold-harmless plays out in practice:.
- Districts with fewer than 350 students are guaranteed at least as much total state funding as they received in 2005-2006. Education policy scholar James Shuls explains, “In theory, this means a school district could lose almost all of its students and still receive the same amount of total dollars as it received in 2005–06. Missouri City School District #56 is an example. In 2011, the school district dropped from 33 students to 18. The total state contribution remained the same. As a result, the school district’s per-pupil expenditure rose from $12,570 per-pupil to $16,379 per-pupil.” Shul found that, in 2016, the five highest-spending school districts in the state all took advantage of the hold-harmless provision. They had an average district-wide enrollment of 84 students.
- Districts with more than 350 students receive at least the level of state funding per Weighted Average Daily Attendance as they did in 2005–06.
- The property wealth hold harmless measure benefits districts with high property values. By using 2004 property value assessments, the formula underestimates the ability of property-wealthy districts to raise revenue. In 2017-18, 14 of the 22 public school districts in St. Louis County received extra “hold-harmless” funding, including some of the wealthiest districts in the state. These districts received about $39 million in state funding in excess of what the Foundation Formula says they need. Brentwood received an additional $537 per average daily attendance, Ladue received an additional $578, and Clayton received an extra $562 per ADA. As the same report points out, “St. Louis County districts with student populations of less than 50 percent [free and reduced lunch] benefit disproportionately, receiving more than half of all hold-harmless dollars allocated within the county. In fact, five out of eight of these districts are property wealthy and wouldn’t be eligible for any state revenue under the Foundation Formula without the hold-harmless provisions” (emphasis added).
2. Statewide Ballot Propositions Can Bypass the Formula.
Statewide funding propositions are allowed to bypass the Foundation Formula and be distributed without consideration of need. The biggest example of this is Proposition C, a 1% state sales tax passed in 1982, that awards districts the same $988 per weighted daily attendance, regardless of local funding ability.
3. Valuing “Performance” in Practice Values White Schools.
The cost of education in the Foundation Formula, or the State Adequacy Target is defined by “performance” school districts, or schools that scored perfectly on the state’s annual performance report. These districts tend to be disproportionately small and White when compared to districts in the St. Louis region. In 2019, all 115 performance districts were majority White with a median White enrollment of 95.1% and a median average daily attendance of 561 students (see appendix for data).
4. Funding by Attendance Misses Underserved Students.
By tying funding to average daily attendance, school districts with high numbers and proportions of low-income students, students with disabilities, and English language learners (groups who are all more likely to be transient and chronically absent) lose funding for students that actually cost more to educate.
What We Looked At
Note: Each of the following indicators were examined by district as well as for majority White and majority Black districts. These classifications were made using 2018-2019 enrollment data from the Missouri Department of Elementary and Secondary Education (MO DESE).
*Note: Our financial numbers likely differ from DESE numbers. This is largely because DESE data excludes some types of expenditures including capital outlay, debt service, community services, non-instruction/support, adult education, and Title I expenditures. Using data from CAFRs, we were able to include these categories of spending that DESE leaves out, though we cannot pinpoint spending in most of these additional categories with the exception of capital outlay and debt service.
What We Found
Majority White School Districts Spend More Per Student
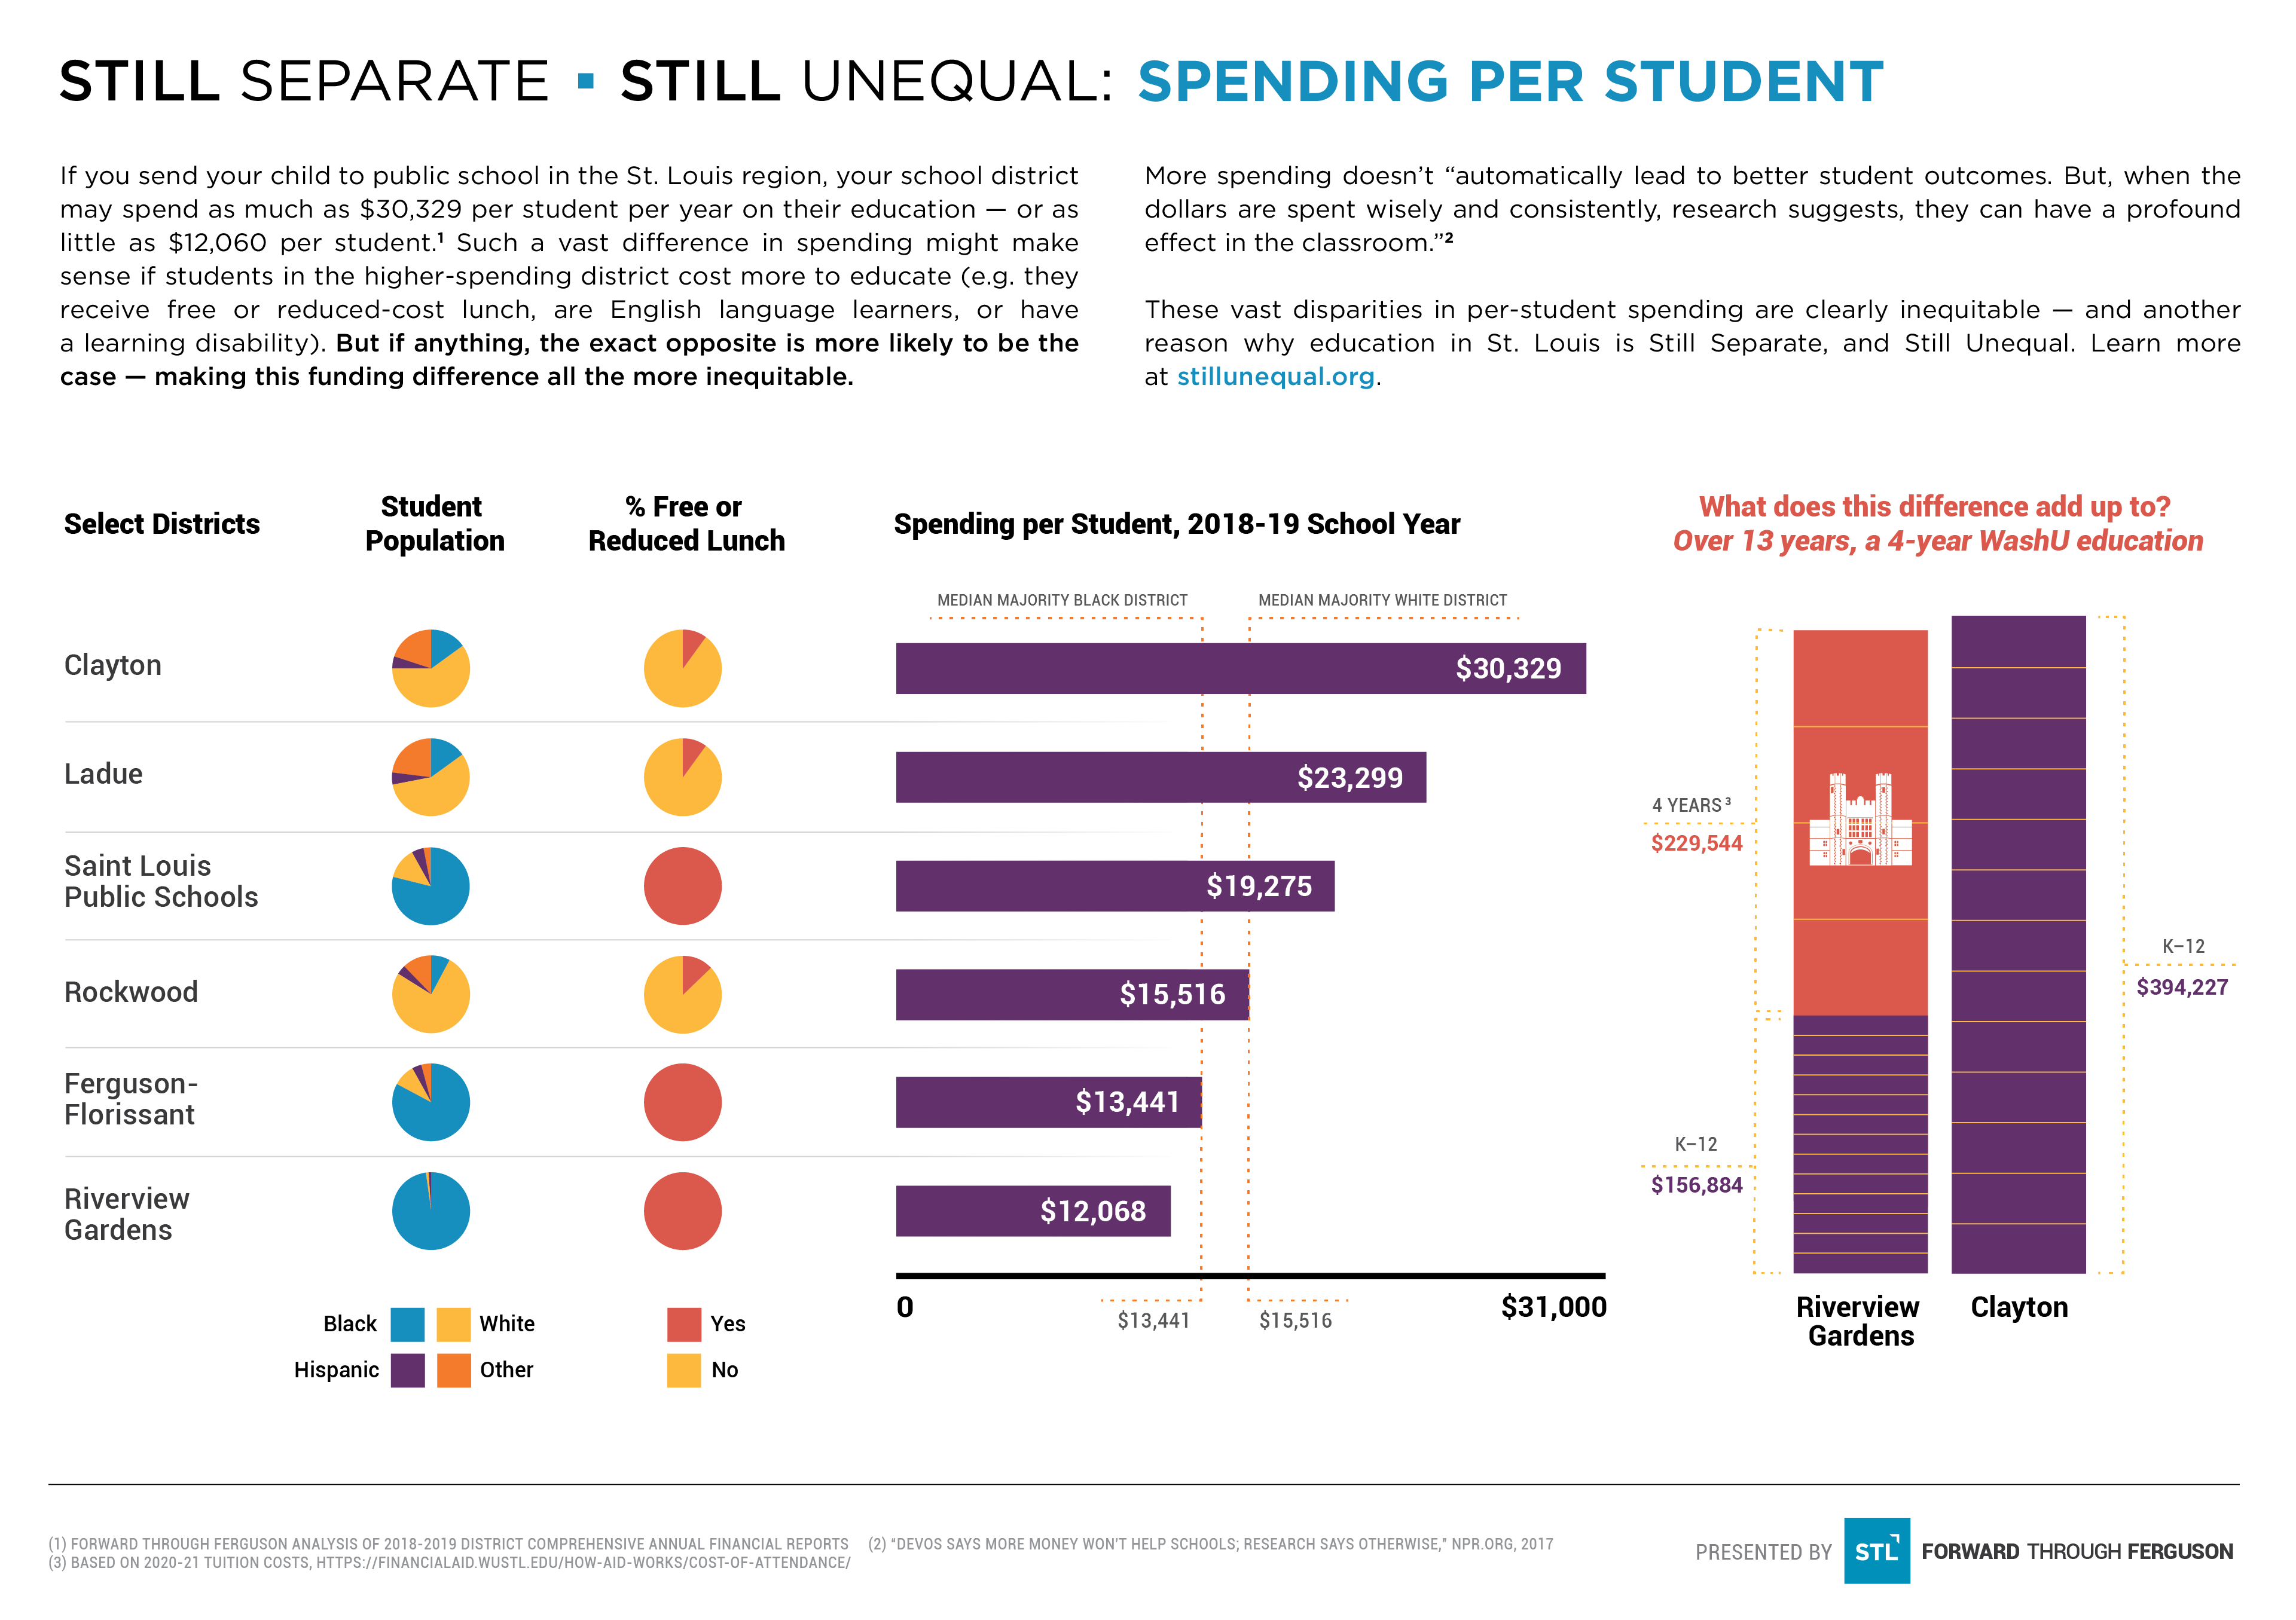
The current Foundation Formula was passed by legislators in 2005 with the stated purpose of ensuring adequate funding for education in all of Missouri’s school districts and leveling the playing field between property-rich and property-poor districts. And yet, in 2018-19, the median majority White school district received $15,285, or 12% more, per student compared to $13,587 for the median majority Black school district. Theoretically, such a difference should happen only if the students in the higher paid district cost more to educate (e.g., receive free or reduced cost lunch, are English language learners, or have a learning disability). If anything, the exact opposite is more likely to be the case, which makes this funding difference all the more inequitable.
Take, for example, the majority White and majority Black districts that received the most funding. In 2018, Brentwood received $5,698 or nearly 30% more per student than SLPS ($25,618 vs. $19,925). This is despite the fact that SLPS enrolled a much higher proportion of students that are more costly to educate: while one in four of Brentwood’s students are eligible for free or reduced cost lunch, 100% of SLPS’ students qualify. SLPS also enrolls more students with special education needs and that are English language learners.
Wealthy White Districts Get More State Funding Than They Should Because of How the Foundation Formula was Structured
Brentwood gets more than its fair share of funding because the funding system ensures it. As discussed in the Background section, the hold harmless provisions in the Foundation Formula allow Brentwood to receive extra funding based on lower property valuations from 2004 despite the fact that its property has increased in value considerably since then. The hold harmless policy, which was intended to set a floor for education funding and ease the transition to the Formula when it was created, today ensures that Brentwood and other districts like it get state dollars that they do not actually need based on their current property wealth. In 2017-2018 Brentwood received an extra $537 per average daily attendance.
That property wealth is why majority White school districts get a much larger portion of their funding from local sources (82% compared to 58% for majority Black school districts). The flip side of this is that majority Black school districts, in addition to generally getting fewer dollars per student overall, rely more heavily on state funding than majority White school districts (31% of funding vs. 14% of funding). Majority Black school districts also get a larger portion of their funds from the federal government (11% vs. 3% for majority White school districts).
Not All Funding Sources Are Equal
Where education dollars come from matters. First, majority Black school districts are disproportionately dependent on the state of Missouri for dollars—and Missouri provides very little state-level funding for education. As a percentage of total revenues, only one other state (NH18) provides less. Second, the state mechanism for filling the gaps in local funding (the Foundation Formula) is, as we’ve discussed, fundamentally inequitable. Third, state education funding is volatile because it is appropriated each year. In its 15 years of existence, the Foundation Formula has only been fully funded 3 times. Because of COVID-19, the Foundation Formula for the 2020-21 school year will fall short by $123M–which will disproportionately hurt majority Black schools. Local funding tends to be far more stable.
St. Louis’ Majority Black Districts Have Less to Spend on Students
The natural consequence of receiving less funding than majority White school districts is that majority Black districts also spend less per student. In 2018-19, the median majority Black district spent $13,441 per student, while the median majority White district spent $15,516. Clayton, the highest spending majority White district, spent $30,329/student, while Normandy, the highest spending majority Black district spent $21,917. As with revenue, a similar pattern emerges: Clayton spends more on its students despite the fact that Normandy’s students are nearly 10 times more likely to receive free or reduced cost lunch. The lowest spending districts, both majority White (Bayless) and majority Black (Riverview Gardens), each spent about $12,000 per student. $12,000 compared to $30,000—the difference is mind boggling. Clayton was deemed the best public high school in the state in 2019. It’s no wonder. We should seriously ask ourselves why all of our children don’t deserve the kind of education that $30,000 could buy them.
Resources for learning more about these topics
- The Stealth Inequities of School Funding, 2012. By Bruce Baker and Sean Corcoran of the Center for American Progress.
Funding Missouri’s Public Schools Comes Down to One Not-So-Simple Formula, 2016. By Dale Singer, Tim Lloyd, and Kameel Stanley.
How Do School Funding Formulas Work? 2017. By The Urban Institute.
- Dismissed: America’s Most Divisive Borders, 2019. By EdBuild.
Is School Funding Fair? A National Report Card, 2017. By: Bruce Baker, Danielle Farrie, Monete Johnson, Theresa Luhm and David G. Sciarra.


